> ## Documentation Index
> Fetch the complete documentation index at: https://docs.datanumia.com/llms.txt
> Use this file to discover all available pages before exploring further.
# Consumption calculation
## Functional description
***
### Main feature
The consumption chart is a Web Component allowing users to follow their **energy consumption** (electricity and/or gas) over time.
#### Visualize energy consumption
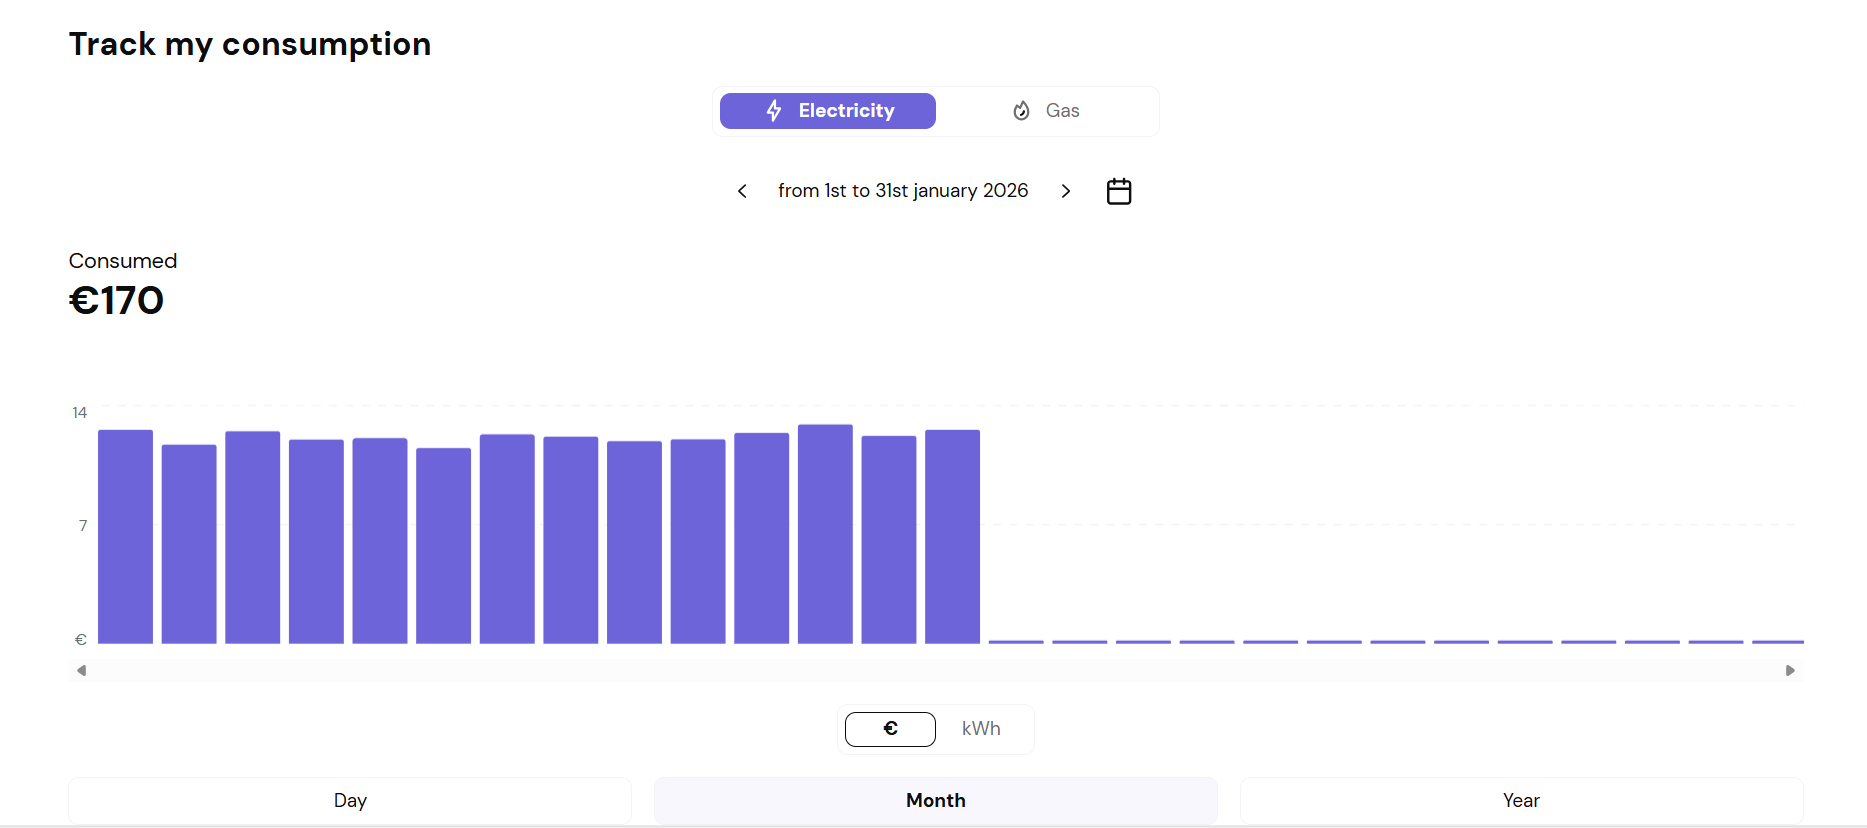
The chart displays the evolution of consumption over a year, a month or a day.\
It also displays forecast consumption for the current month.
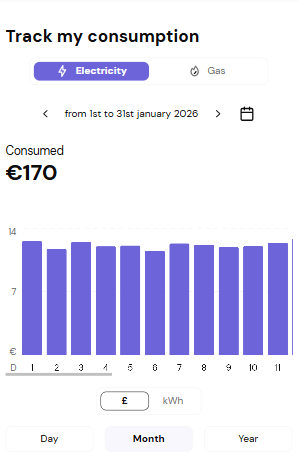 **By default, the client sees** :
The **total energy consumed** during the **current month**, in a given **currency**
If today is the 1st of the month, the chart displays the **previous month**, as the latest available data is always **yesterday**
The consumption **forecast** for the **current month**
Once the month has ended, the forecast disappears and is replaced by actual consumption.
The consumption of each **past day** of the current month
No data appears between **yesterday** and the end of the month.
### Detailed features
**Choose a period**
A user can view the evolution of their consumption over different timeframes —**year, month, or day**— using the **dedicated period selector**.\
Then, in each timeframe, a user can select a **specific** year, month or day using the **datePicker** element.
**Year timeframe**
* Shows consumption per month
* Limited to the last 3 years (GDPR compliance)
**Month timeframe**
Shows consumption per day
**Day timeframe**
Shows consumption throughout the day.
As mentioned earlier, **current‑day** consumption is **not available**.
The consumption curve resolution can be configured through the web component input `dayViewTimeStep`, expressed in **minutes**.
Examples:
* `15` minutes → 96 points displayed over a day
* `30` minutes → 48 points displayed over a day
* `60` minutes → 24 points displayed over a day
**Choose a fluid (electrity or gas)**
If the user has both electricity and gas, the switch allows changing the fluid.\
If only one exists, only that one is displayed.
Below an example for a user who has an electricty and gaz contract :
**By default, the client sees** :
The **total energy consumed** during the **current month**, in a given **currency**
If today is the 1st of the month, the chart displays the **previous month**, as the latest available data is always **yesterday**
The consumption **forecast** for the **current month**
Once the month has ended, the forecast disappears and is replaced by actual consumption.
The consumption of each **past day** of the current month
No data appears between **yesterday** and the end of the month.
### Detailed features
**Choose a period**
A user can view the evolution of their consumption over different timeframes —**year, month, or day**— using the **dedicated period selector**.\
Then, in each timeframe, a user can select a **specific** year, month or day using the **datePicker** element.
**Year timeframe**
* Shows consumption per month
* Limited to the last 3 years (GDPR compliance)
**Month timeframe**
Shows consumption per day
**Day timeframe**
Shows consumption throughout the day.
As mentioned earlier, **current‑day** consumption is **not available**.
The consumption curve resolution can be configured through the web component input `dayViewTimeStep`, expressed in **minutes**.
Examples:
* `15` minutes → 96 points displayed over a day
* `30` minutes → 48 points displayed over a day
* `60` minutes → 24 points displayed over a day
**Choose a fluid (electrity or gas)**
If the user has both electricity and gas, the switch allows changing the fluid.\
If only one exists, only that one is displayed.
Below an example for a user who has an electricty and gaz contract :
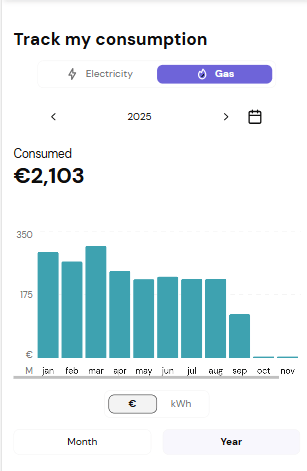 In bi‑energy mode, switching fluid **keeps the context** : period, unit (kWh or currency), and view (year/month/day), excepts :
> There is **no day view** for gas.
> If day view is selected in electricity, switching to gas returns to month view.
**Units : kWh or currency**
The user can switch between **kWh** and a **given currency**.\
It will display consumption evolution accordingly.
In a given currency view, users are informed that the displayed amounts are estimates and that the invoice remains the reference.
**Consumption details**
Each view (year, month, day, kWh, currency) allows seeing **detailed parts of consumption** when user clicks on a specific bar graph.
In bi‑energy mode, switching fluid **keeps the context** : period, unit (kWh or currency), and view (year/month/day), excepts :
> There is **no day view** for gas.
> If day view is selected in electricity, switching to gas returns to month view.
**Units : kWh or currency**
The user can switch between **kWh** and a **given currency**.\
It will display consumption evolution accordingly.
In a given currency view, users are informed that the displayed amounts are estimates and that the invoice remains the reference.
**Consumption details**
Each view (year, month, day, kWh, currency) allows seeing **detailed parts of consumption** when user clicks on a specific bar graph.
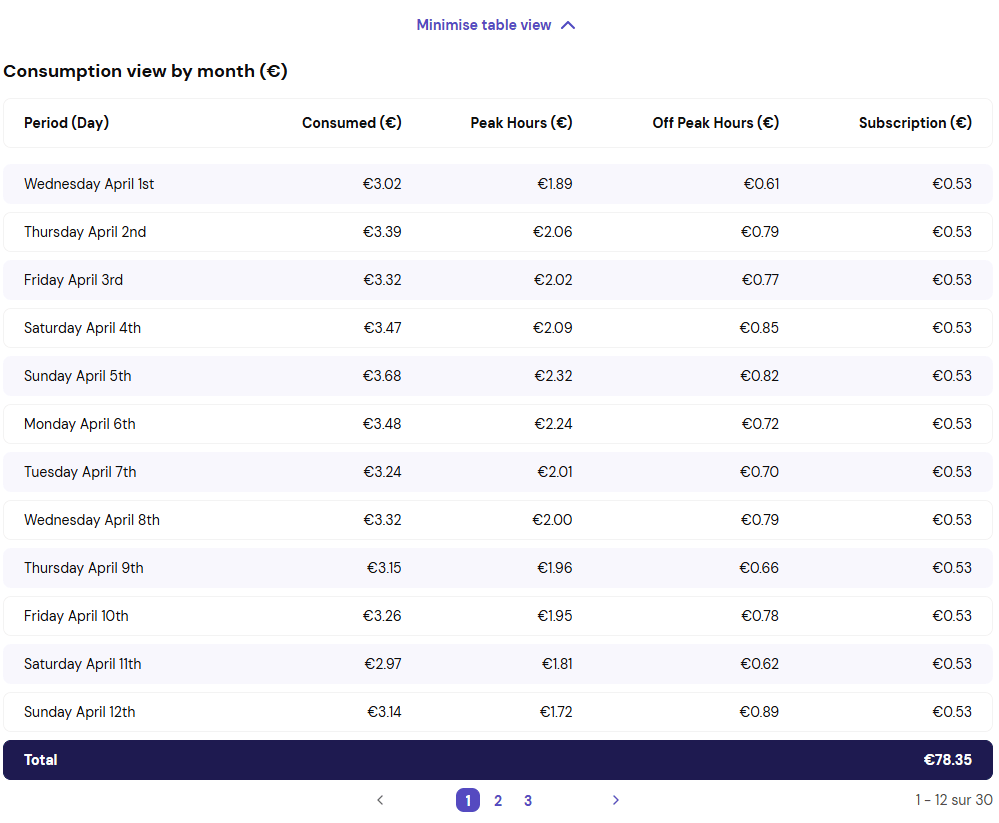
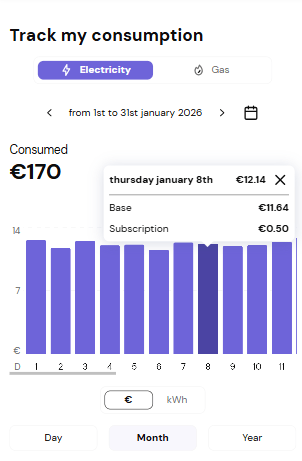 *Example* : with a peak/off‑peak contract, the user sees for each day :
* Peak hours consumption
* Off‑peak consumption
* Standing charges
***
### Responsiveness
The component is fully responsive (mobile, tablet, desktop).\
We take up the **entire width**. It's up to the **integrator** to **define** the desired **container size**.
Depending on the screen size, the number and thickness of bars adjust progressively at defined breakpoints.
*Tablet*
*Example* : with a peak/off‑peak contract, the user sees for each day :
* Peak hours consumption
* Off‑peak consumption
* Standing charges
***
### Responsiveness
The component is fully responsive (mobile, tablet, desktop).\
We take up the **entire width**. It's up to the **integrator** to **define** the desired **container size**.
Depending on the screen size, the number and thickness of bars adjust progressively at defined breakpoints.
*Tablet*
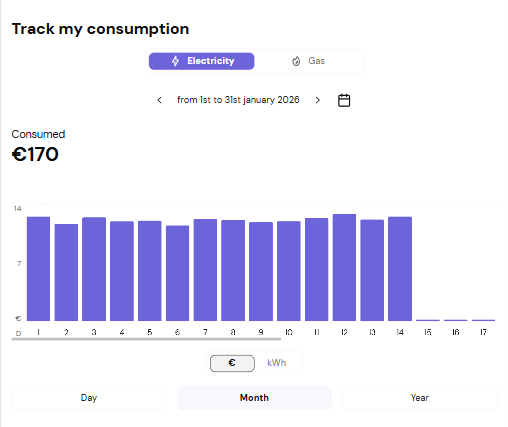 *Desktop*
 ***
### Provider customization
The web component can be adapted to your graphic charter (colors, button radius, fonts).
The chart itself can be customized :
* Bar colors (normal & hovered)
* Bar radius
* Different themes for electricity and gas
Each variable is described [here](/docs/DeveloperTools/HomeInteface/05-home-basic/01-consumption-calculation#css-variables)
***
### Language management
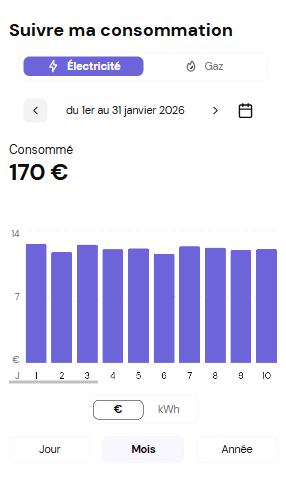
The consumption chart is available in two languages :
* en-GB
* fr
Below an example in french :
***
### Provider customization
The web component can be adapted to your graphic charter (colors, button radius, fonts).
The chart itself can be customized :
* Bar colors (normal & hovered)
* Bar radius
* Different themes for electricity and gas
Each variable is described [here](/docs/DeveloperTools/HomeInteface/05-home-basic/01-consumption-calculation#css-variables)
***
### Language management
The consumption chart is available in two languages :
* en-GB
* fr
Below an example in french :
 ***
### Accessibility
The keyboard **tabulation navigation** follows the order below :
1. Fluid switch
2. Datepicker
3. Consumption graph
4. Switch units
5. Switch steps
The keyboard **arrow navigation** allows to navigate through the elements of the web component.\
A dedicated live area will announce dynamic changes to notify user.
At the bottom of the consumption chart, we provide an easy-to-use, comprehensible, paginated table that contains all the elements mentioned in the chart and its tooltip. This table is wrapped in a panel that allows it to take up as little space as possible when it is not being consulted by the user.
***
### Accessibility
The keyboard **tabulation navigation** follows the order below :
1. Fluid switch
2. Datepicker
3. Consumption graph
4. Switch units
5. Switch steps
The keyboard **arrow navigation** allows to navigate through the elements of the web component.\
A dedicated live area will announce dynamic changes to notify user.
At the bottom of the consumption chart, we provide an easy-to-use, comprehensible, paginated table that contains all the elements mentioned in the chart and its tooltip. This table is wrapped in a panel that allows it to take up as little space as possible when it is not being consulted by the user.
 ***
### API used to display consumption data
* Energy consumption API → actual consumption
* Consumption forecast API → predicted consumption
***
[Integration of the web component 'Consumption calculation'](/docs/DeveloperTools/HomeInteface/05-home-basic/01-consumption-calculation)
***
### API used to display consumption data
* Energy consumption API → actual consumption
* Consumption forecast API → predicted consumption
***
[Integration of the web component 'Consumption calculation'](/docs/DeveloperTools/HomeInteface/05-home-basic/01-consumption-calculation)