> ## Documentation Index
> Fetch the complete documentation index at: https://docs.datanumia.com/llms.txt
> Use this file to discover all available pages before exploring further.
# Consumption calculation
## Integration of the web component
This is a more technical section dedicated to developers.
For a specific environment, use the correct base uri, specified in this section : [Insert a webcomponent.](/docs/DeveloperTools/HomeInteface/01-how-to-insert-webcomponents-in-an-app)
### Usage
Below is an example of implementation with day-view-time-step specific value :
```html html theme={null}
```
```css css theme={null}
:root {
--dtn-graph-bar-radius: 4px;
--dtn-graph-bar-background: #d9d964;
--dtn-graph-bar-hovered-background: #e2e27a;
}
```
The `dtn-consumption-monitoring` HTML element implements a shadow DOM that allows it to be isolated from the rest of the application. For more information on what a shadow DOM is, please refer to the "What is a web component" section.
### Inputs
#### day-view-time-step
Input that allows the integrator to change the time step on the day view
* **Name:** `day-view-time-step`
* **Required:** No
* **Type:** number
* **Default value:** `60`
The recommended values for `dayViewTimeStep` are between **2 minutes** and **1440 minutes**.
Values lower than 2 minutes may cause the Energy Consumption API to return a 4xx error.
Values greater than 1440 minutes may return truncated data limited to a 24-hour period.
The values functionally validated during acceptance testing are:
* 15 minutes
* 30 minutes
* 60 minutes
The horizontal scrollbar behavior depends on both:
* the configured time step
* the available display width
Smaller intervals result in more displayed bars and may therefore introduce horizontal scrolling, including on some desktop screens. This behavior is expected and ensures that all returned data remains accessible.
### Outputs
No output to specify for this web component
### Error handling
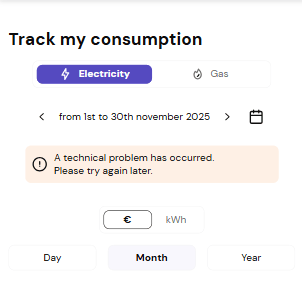
Sometimes, the consumption chart cannot be displayed.
Use case 1 : **API consumption** returns 400/500
A message is displayed.
If the hosting server fails, nothing is displayed. Only console errors appear.
Use case 2 : **Forecast API** returns 400/500
The chart displays normally, but a message indicates that the forecast is unavailable.
***
### Loading state handling
If the data loads slowly (bad connection or API response > 300 ms), a **skeleton loader** appears to :
* indicate that data is coming
* give an overview of the final layout
* prevents the rebound effect
***
### CSS Variables
Define the default color of the chart bars.
Default: `#6e64d9`
Match pattern: `CSS Color`
Define the color of the chart bars for the electric fluid.
Default: `#6e64d9`
Match pattern: `CSS Color`
Define the color of the chart bars for the gas fluid.
Default: `#3EA2B0`
Match pattern: `CSS Color`
Defines the color of the chart bars when hovered over by the user.
Default: `#4b44a3`
Match pattern: `CSS Color`
Specifies the color of the chart bars for the electric fluid when hovered over by the user.
Default: `#4b44a3`
Match pattern: `CSS Color`
Specifies the color of the chart bars for the gas fluid when hovered over by the user.
Default: `#3b7b84`
Match pattern: `CSS Color`
Defines the border radius of the chart bars.
Default: `2px`
Match pattern: `pixels`
```json json_schema theme={null}
{
type: "object",
properties: {
"--dtn-graph-bar-background": {
"type": "string",
description: "Define the default color of the chart bars.",
default: "#6e64d9",
pattern: "CSS Color",
}
"--dtn-graph-elec-bar-background": {
"type": "string",
description: "Define the color of the chart bars for the electric fluid.",
default: "#6e64d9",
pattern: "CSS Color",
}
"--dtn-graph-gas-bar-background": {
"type": "string",
description: "Define the color of the chart bars for the gas fluid.",
default: "#3EA2B0",
pattern: "CSS Color",
},
"--dtn-graph-bar-hovered-background": {
"type": "string",
description: "Defines the color of the chart bars when hovered over by the user.",
default: "-#4b44a3",
pattern: "CSS Color",
}
"--dtn-graph-elec-bar-hovered-background": {
"type": "string",
description: "`ZBE : C'est la couleur par defaut, right ? `Specifies the color of the chart bars for the electric fluid when hovered over by the user.",
default: "#4b44a3",
pattern: "CSS Color",
}
"--dtn-graph-gas-bar-hovered-background": {
"type": "string",
description: "Specifies the color of the chart bars for the gas fluid when hovered over by the user.",
default: "#3b7b84",
pattern: "CSS Color",
},
"--dtn-graph-bar-radius": {
type: "string",
description: "Defines the border radius of the chart bars.",
default: "2px",
pattern: "pixels"
}
}
}
```
***
### Authentication
To Access to data required to render this component, you first need to setup security in your application by following the guidelines listed in the Security for HOME Interfaces section. [See more details in this section.](/docs/DeveloperTools/HomeInteface/04-security)