

Integration of the web component
This is a more technical section dedicated to developers. For a specific environment, use the correct base uri, specified in this section : Insert a webcomponent.Usage
Below is an example of implementation with day-view-time-step specific value :dtn-consumption-monitoring HTML element implements a shadow DOM that allows it to be isolated from the rest of the application. For more information on what a shadow DOM is, please refer to the “What is a web component” section.
Inputs
day-view-time-step
Input that allows the integrator to change the time step on the day view- Name:
day-view-time-step - Required: No
- Type: number
- Default value:
60
dayViewTimeStep are between 2 minutes and 1440 minutes.
The values functionally validated during acceptance testing are:
- 15 minutes
- 30 minutes
- 60 minutes
- the configured time step
- the available display width
Outputs
No output to specify for this web componentError handling
Sometimes, the consumption chart cannot be displayed. Use case 1 : API consumption returns 400/500 A message is displayed.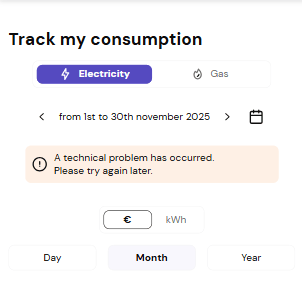
If the hosting server fails, nothing is displayed. Only console errors appear.
Loading state handling
If the data loads slowly (bad connection or API response > 300 ms), a skeleton loader appears to :- indicate that data is coming
- give an overview of the final layout
- prevents the rebound effect
CSS Variables
string
Define the default color of the chart bars.Default:
#6e64d9Match pattern: CSS Colorstring
Define the color of the chart bars for the electric fluid.Default:
#6e64d9Match pattern: CSS Colorstring
Define the color of the chart bars for the gas fluid.Default:
#3EA2B0Match pattern: CSS Colorstring
Defines the color of the chart bars when hovered over by the user.Default:
#4b44a3Match pattern: CSS Colorstring
Specifies the color of the chart bars for the electric fluid when hovered over by the user.Default:
#4b44a3Match pattern: CSS Colorstring
Specifies the color of the chart bars for the gas fluid when hovered over by the user.Default:
#3b7b84Match pattern: CSS Colorstring
Defines the border radius of the chart bars.Default:
2pxMatch pattern: pixels