

Functional description
Main feature
The consumption chart is a Web Component allowing users to follow their energy consumption (electricity and/or gas) over time.Visualize energy consumption
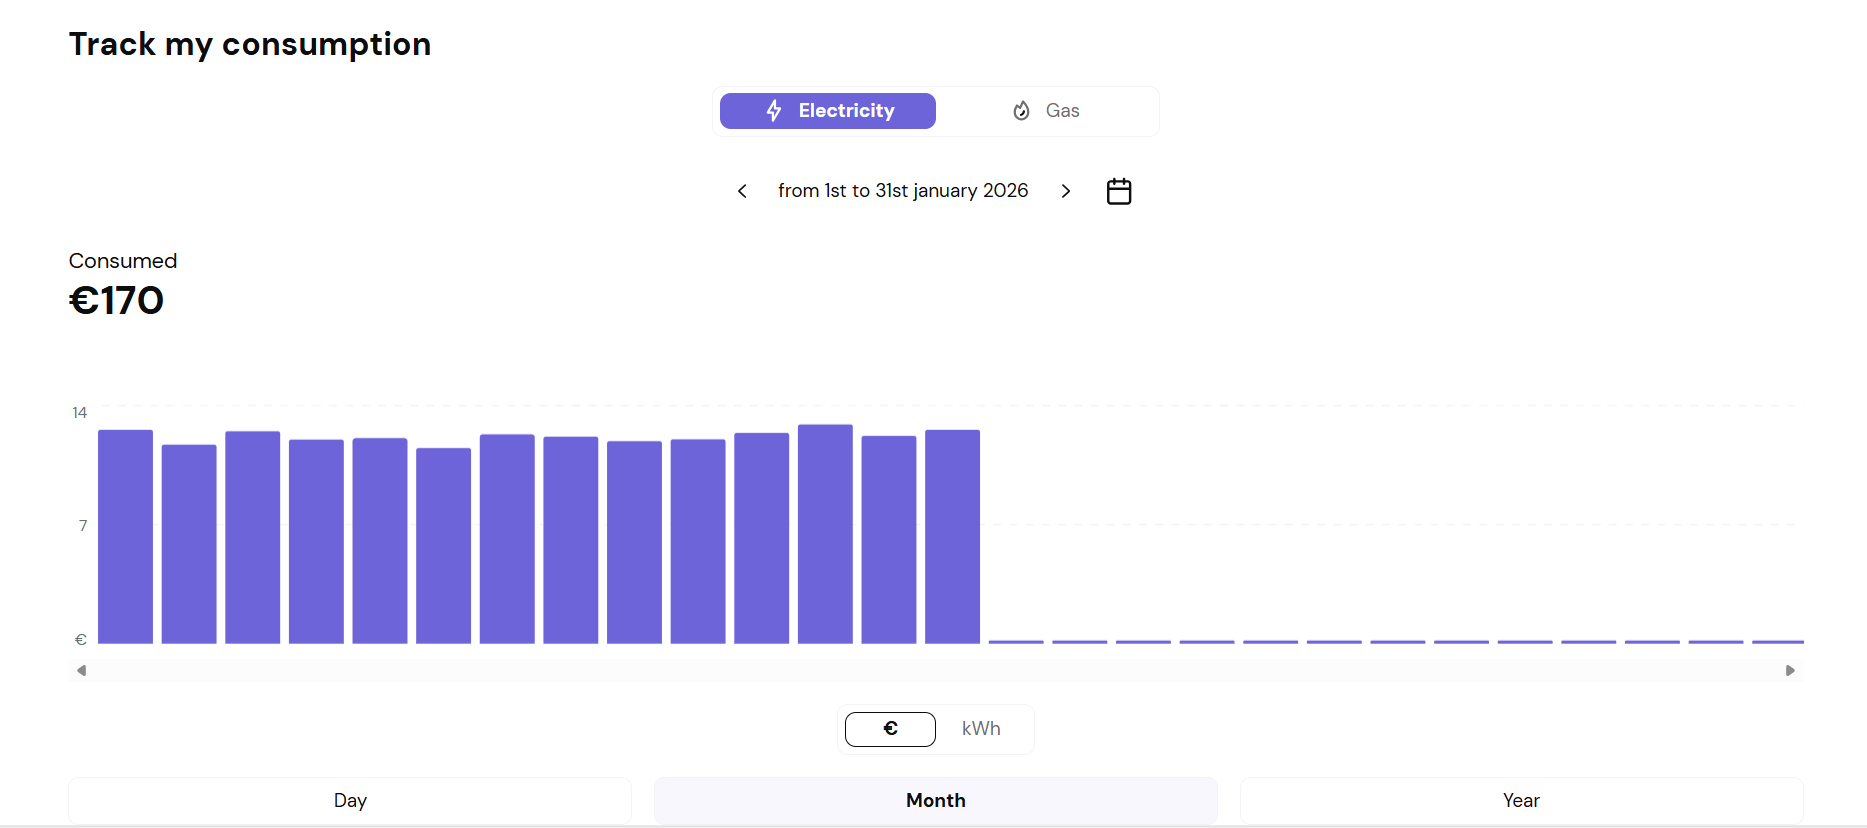
The chart displays the evolution of consumption over a year, a month or a day.It also displays forecast consumption for the current month.
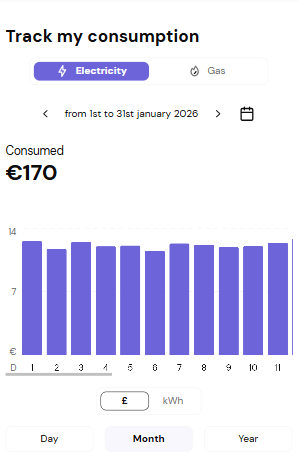
If today is the 1st of the month, the chart displays the previous month, as the latest available data is always yesterday
Once the month has ended, the forecast disappears and is replaced by actual consumption.
No data appears between yesterday and the end of the month.
Detailed features
Choose a period A user can view the evolution of their consumption over different timeframes —year, month, or day— using the dedicated period selector.Then, in each timeframe, a user can select a specific year, month or day using the datePicker element. Year timeframe
- Shows consumption per month
- Limited to the last 3 years (GDPR compliance)
dayViewTimeStep, expressed in minutes.
Examples:
15minutes → 96 points displayed over a day30minutes → 48 points displayed over a day60minutes → 24 points displayed over a day
If only one exists, only that one is displayed. Below an example for a user who has an electricty and gaz contract :
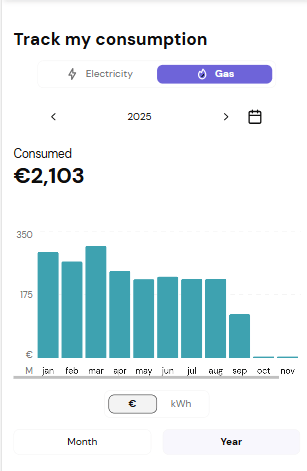
It will display consumption evolution accordingly. In a given currency view, users are informed that the displayed amounts are estimates and that the invoice remains the reference. Consumption details Each view (year, month, day, kWh, currency) allows seeing detailed parts of consumption when user clicks on a specific bar graph.
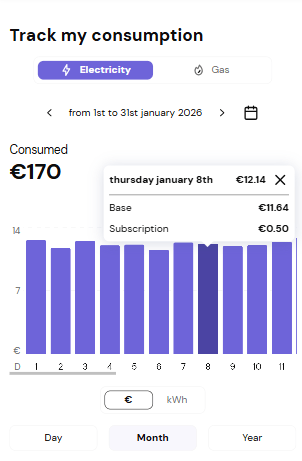
- Peak hours consumption
- Off‑peak consumption
- Standing charges
Responsiveness
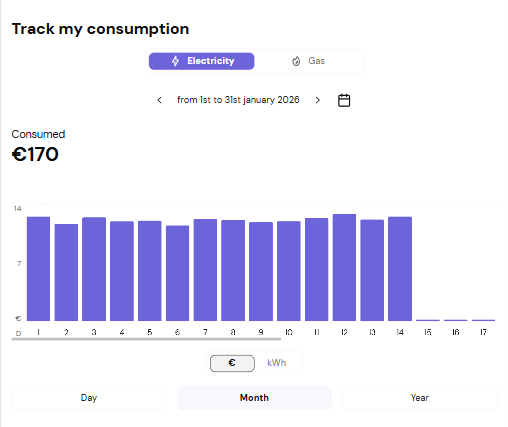
The component is fully responsive (mobile, tablet, desktop).We take up the entire width. It’s up to the integrator to define the desired container size.
Depending on the screen size, the number and thickness of bars adjust progressively at defined breakpoints.
Provider customization
The web component can be adapted to your graphic charter (colors, button radius, fonts). The chart itself can be customized :- Bar colors (normal & hovered)
- Bar radius
- Different themes for electricity and gas
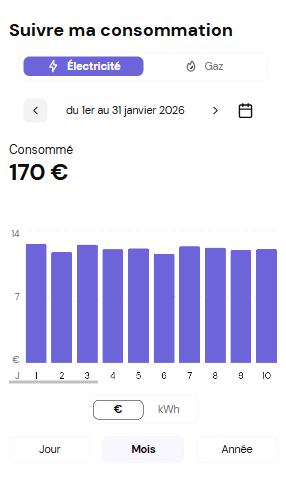
Language management
The consumption chart is available in two languages :- en-GB
- fr
Accessibility
The keyboard tabulation navigation follows the order below :- Fluid switch
- Datepicker
- Consumption graph
- Switch units
- Switch steps
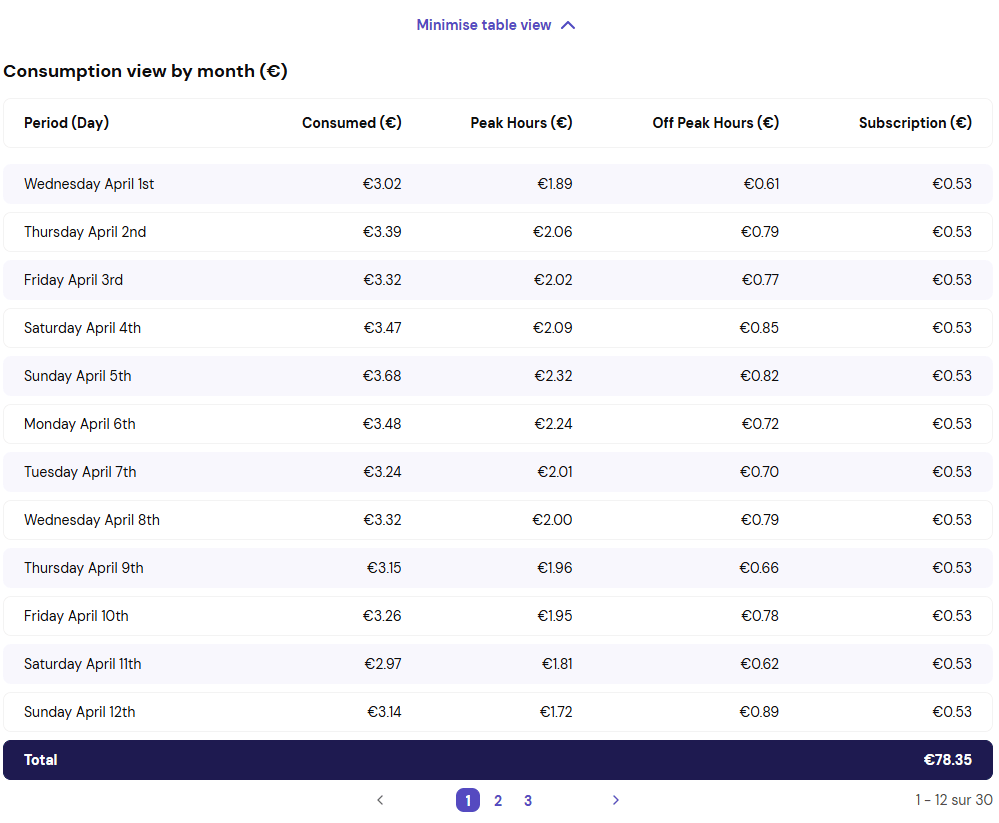
A dedicated live area will announce dynamic changes to notify user. At the bottom of the consumption chart, we provide an easy-to-use, comprehensible, paginated table that contains all the elements mentioned in the chart and its tooltip. This table is wrapped in a panel that allows it to take up as little space as possible when it is not being consulted by the user.
API used to display consumption data
- Energy consumption API → actual consumption
- Consumption forecast API → predicted consumption
Integration of the web component ‘Consumption calculation’